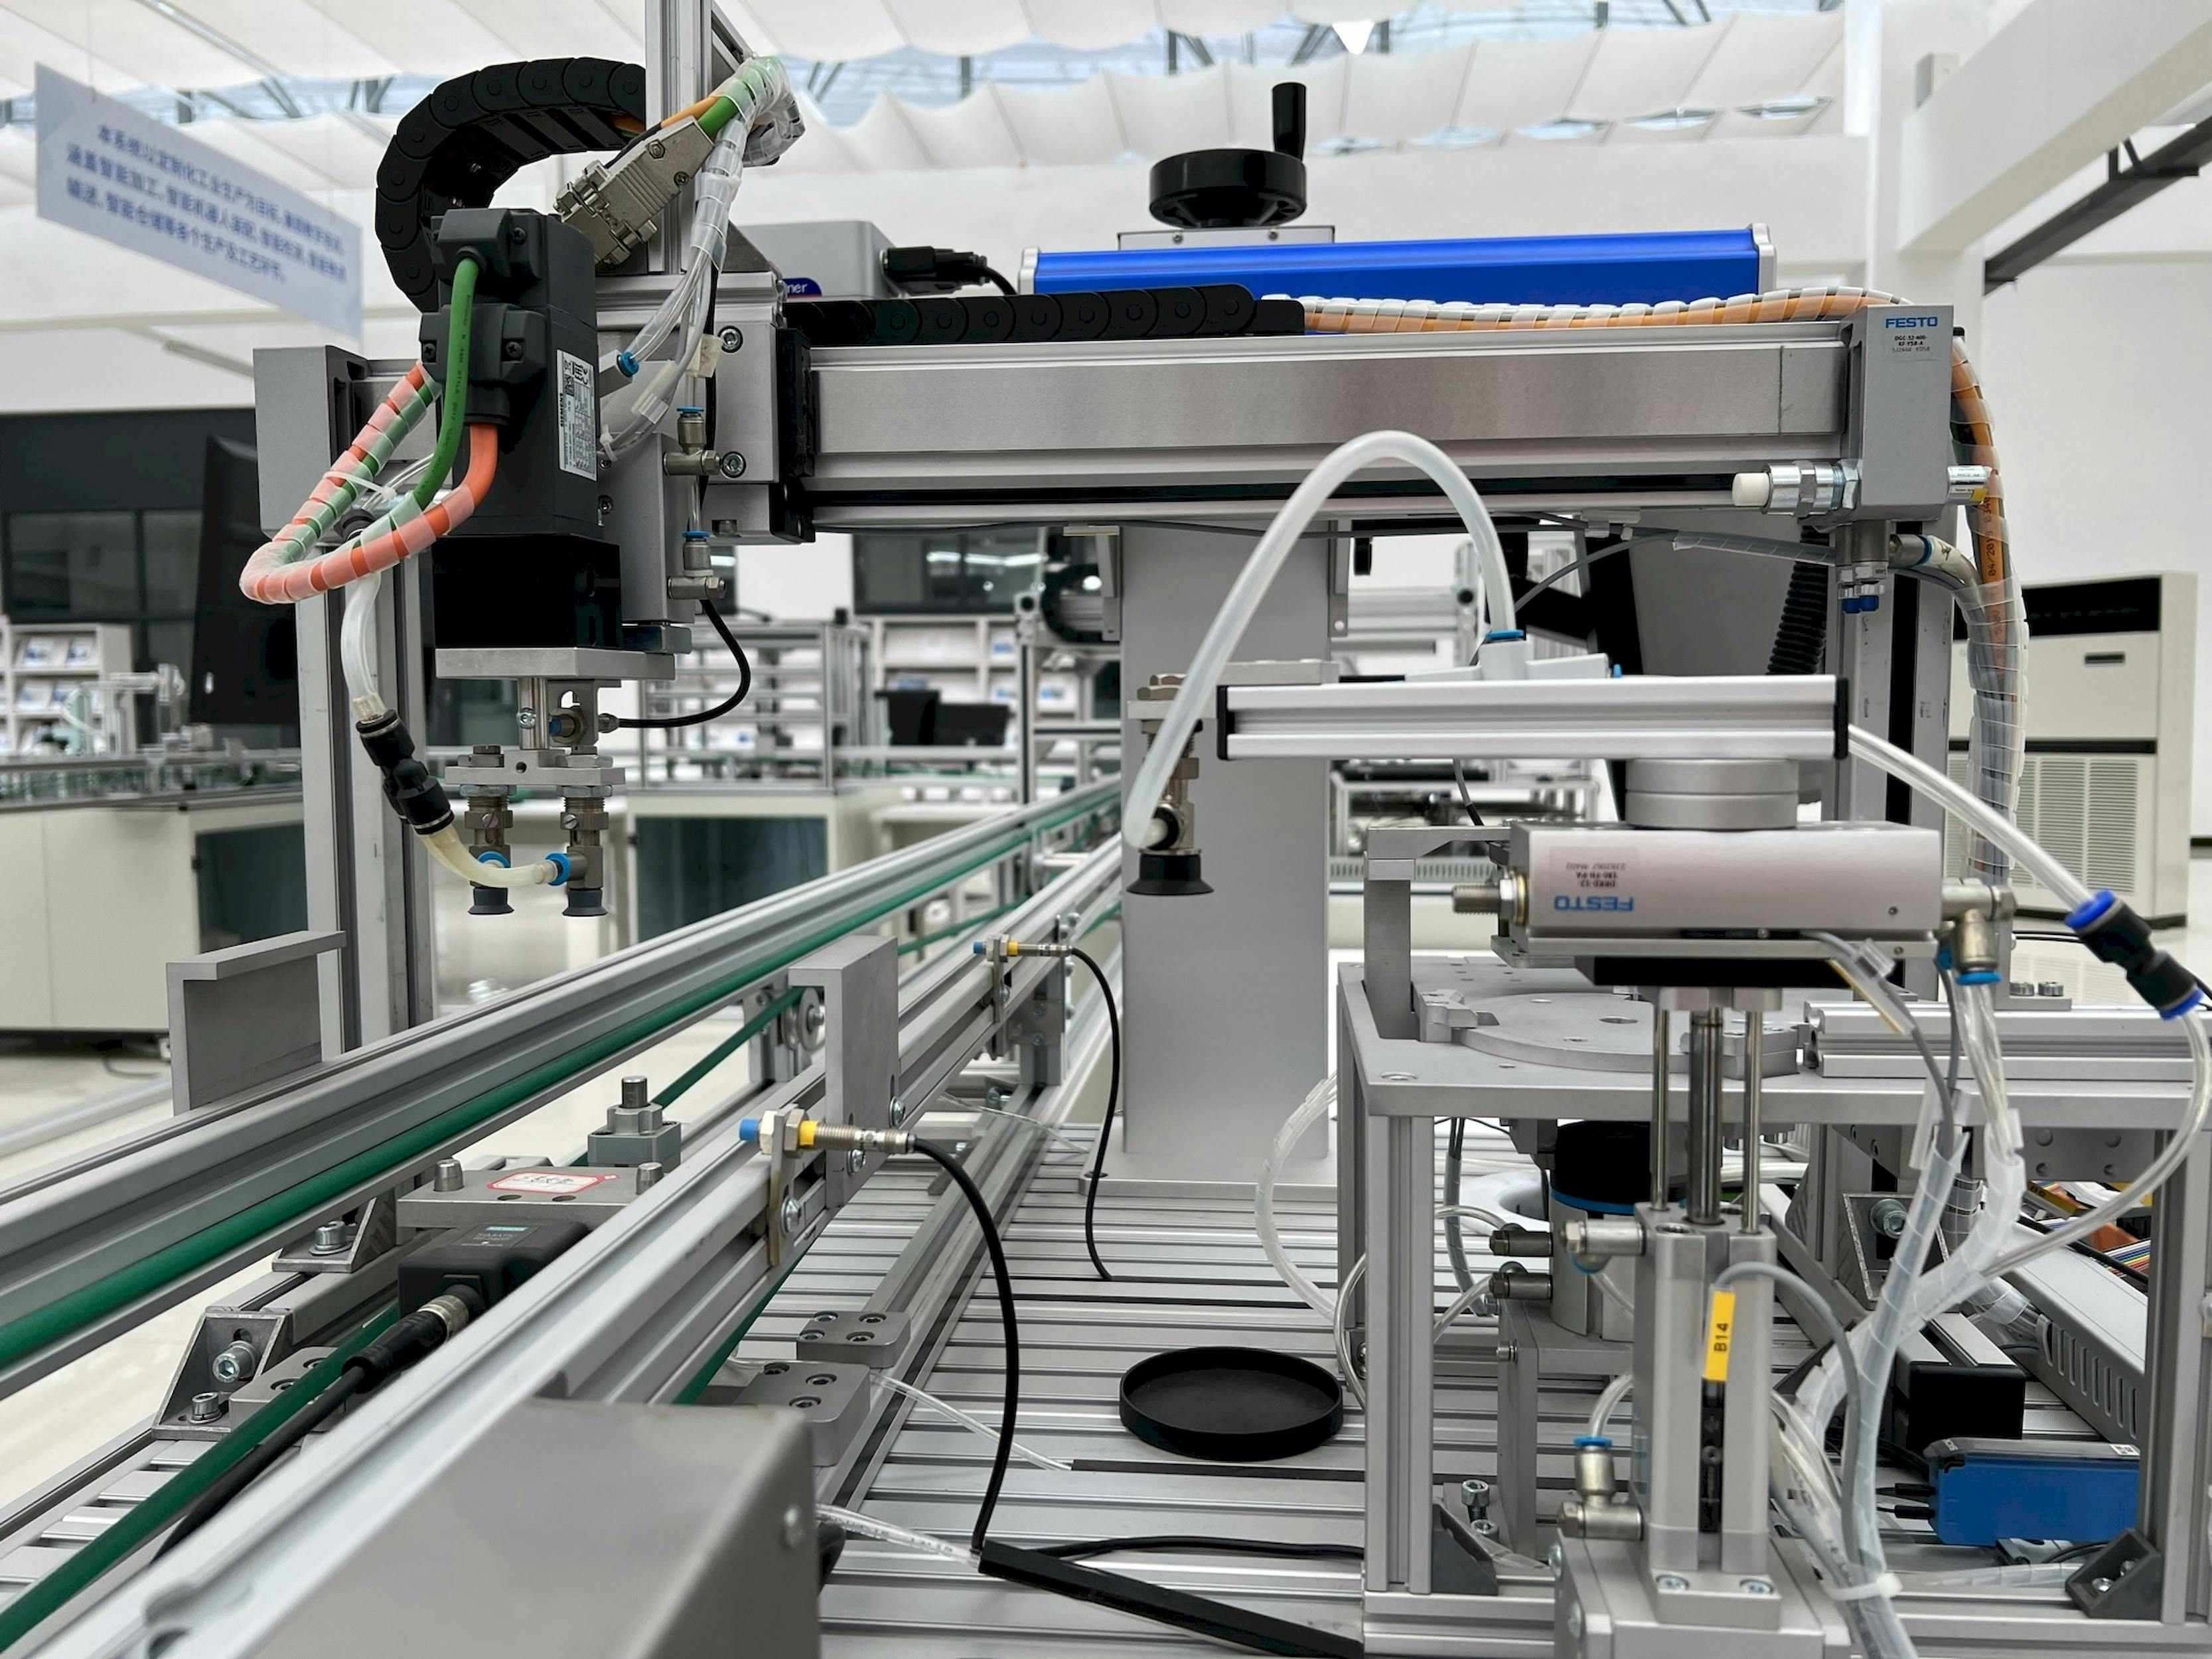
The Challenge
Throughput often fluctuates even with identical machines, operators, and setups. One line or shift consistently outperforms another, yet managers cannot explain why. These variations hide untapped capacity and force plants into premature capex decisions instead of getting more from what they already own.
The Solution with SIA
SIA applies statistical profiling and machine learning to your historical production data, including shift-level output, machine parameters, and operator inputs. It surfaces the hidden drivers that impact throughput, process settings, material quality, line balancing, or operator behavior.
Instead of dashboards, SIA provides plain-English recommendations: which lines consistently underperform and why, which combinations yield the highest throughput, and what changes are likely to improve performance.
Impact You Can Measure
- Higher throughput using existing assets, without new capex
- Standardization of best-performing conditions across shifts or plants
- Faster identification of bottlenecks and loss contributors
- Improved OEE (Overall Equipment Effectiveness) and delivery reliability
Real-World Example
In industries like injection molding or fabrication, teams often see higher output on certain shifts or machines without knowing why. By reviewing shift logs and production summaries, manufacturers have identified practices such as faster changeovers or better tool preparation routines that drive better performance. Standardizing these practices has led to more consistent throughput across operations.
FAQs
Yes. SIA works with exported files such as Excel, CSV, or PDFs. Manufacturers can start analyzing their data without any integration or technical setup.
Useful data includes shift logs, cycle time records, machine output reports, operator assignments, and job histories. Even partial or summary-level data can reveal patterns in performance.
Traditional dashboards show what is happening on the shop floor. SIA goes further by using machine learning and statistics to explain why throughput varies and what changes could improve it.
